
Event log
Every webhook delivery attempt and the response your endpoint returned, newest first. This is where you go when someone says “your webhook never fired”.
Find it at Settings → Event log
(rcs.splashifypro.com/settings/events). Every role can read it.
You need at least one webhook first
The log records deliveries, so an account with no endpoints configured has nothing to show. Set one up under Webhooks and the attempts start appearing immediately.
What a row is
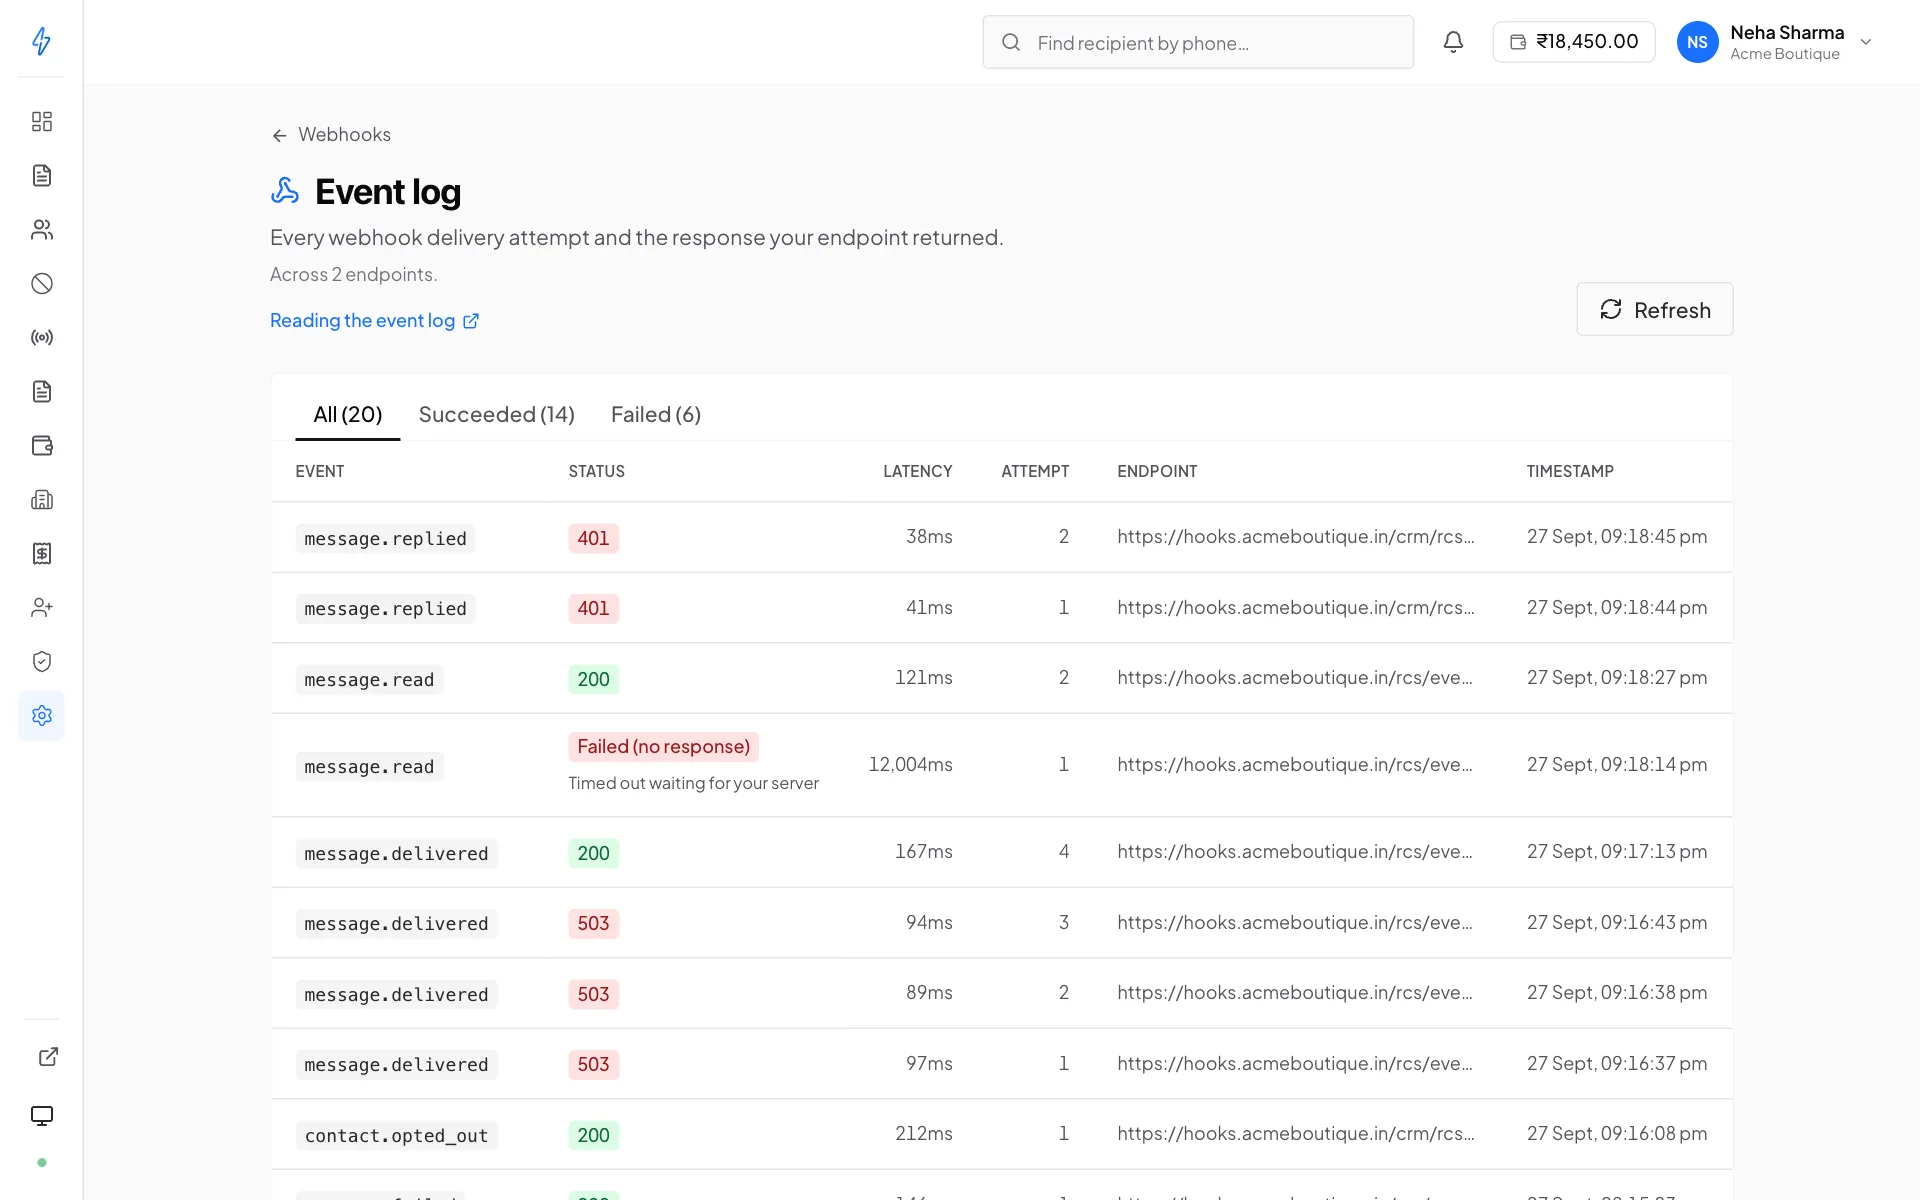
One row is one attempt to deliver one event to one endpoint. A single event that had to be retried therefore appears several times. That is the retry schedule working, not a duplicate.
A row marked Failed (no response) never got an HTTP answer. The request timed out, the connection was refused, or your domain did not resolve, and the line under it says which. It is a failure like any other and is retried the same way.
Reading it
The tabs filter by outcome: All, Succeeded and Failed. Failed is usually the first one to open when something is wrong.
- One event, several rows
Attempts 1–3 failing and attempt 4 succeeding is a healthy integration surviving a blip. Nothing to fix.
- Every attempt around 12 seconds
Your endpoint is too slow. Each attempt waits 12 seconds for your reply, then counts as failed. Acknowledge with a
200as soon as you have the payload and do the real work afterwards, rather than processing before you reply.- A wall of 401s or 403s
Almost always a rotated signing secret that the receiving service was never updated with. Check what your consumer is verifying against.
- A wall of 404s
The route moved. Update the URL on the endpoint under Settings → Webhooks.
- Nothing at all for an event you expected
The endpoint is probably not subscribed to that event type. Open it under Webhooks and check the event checkboxes.
It is a recent tail, not the whole history
The log holds the most recent attempts per endpoint, the footnote on the page says as much. There is no way to page back through older attempts.
Do not treat this as your archive
If you need webhook history for audit or reconciliation, keep your own. The
Event log API exposes the same rows, so a periodic pull into your own
store is straightforward, and your own server's access logs, correlated on the delivery id we
send in the X-SplashifyPro-Delivery header, are the other half of the picture.
You may also see a note that the log is partial. That means one of your endpoints could not be read at that moment, so its attempts are missing from the table. Refresh. It is usually transient.
Dead-letter queue
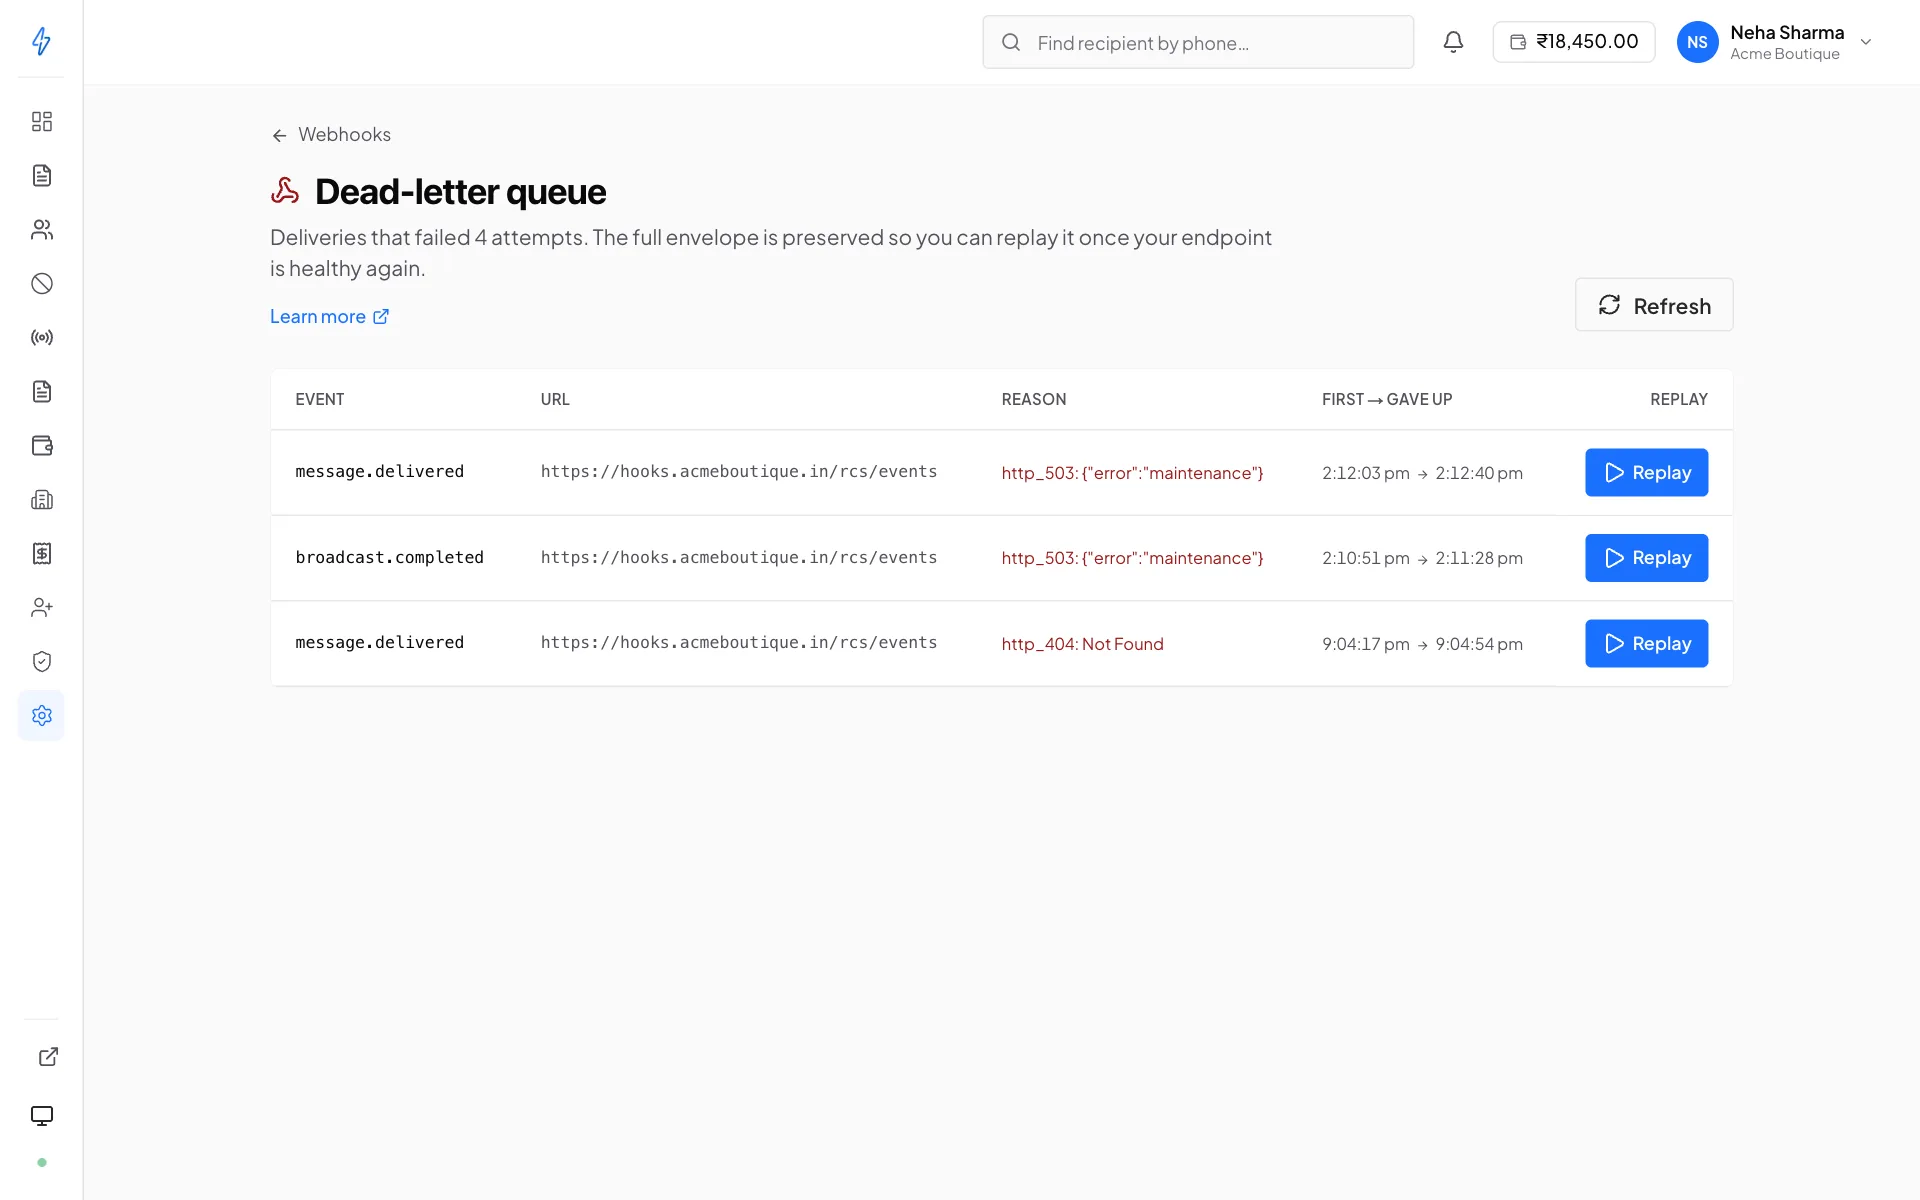
A delivery that fails is retried three more times, at 1 second, 5 seconds and 30 seconds. If all four attempts fail, it stops being retried and lands in the dead-letter queue, reachable from the Event log, or at Settings → Webhooks → Dead-letter.
Everything in that queue is an event your server never received. No amount of healthy-looking traffic elsewhere changes that; if there is a gap in your data, this is the first place to look.
Each row shows the event, the endpoint, why it was abandoned, when we first tried and when we gave up.
Replaying
Replay re-queues the archived event for delivery. It gets a fresh delivery id and the full four-attempt schedule again, and the row is removed from the queue so it cannot be replayed twice by accident.
Fix the cause first
A replay against a still-broken endpoint just fails again and lands straight back in the queue. Confirm the endpoint is healthy, the Test button on the webhook does exactly this.
Replay the affected rows
One at a time, from the dead-letter page.
Confirm in the Event log
The replay appears as a new attempt. A 2xx means it landed.
Your consumer must be idempotent
A replayed event is one your server may have already partially processed before it failed. It might have written a row and then crashed before replying. Deduplicate on the delivery id, or on the business fact in the payload. Assuming a replayed event is one you have never seen is how duplicate orders get created.
The payload is replayed exactly as it was originally sent. It is not
recalculated from current state, so replaying last week's broadcast.completed
delivers last week's counters, which is what you want for reconciliation, and
worth knowing before you use one to refresh a dashboard.
When to use this page
- Wiring up a new integration
Send a test from Settings → Webhooks, then come here and read what your server actually replied. Far faster than adding logging on your side and redeploying.
- Someone reports a missing event
Filter by event type. Either there is a row, and the status and response settle the argument, or there is not, and the endpoint is not subscribed to it.
- After an incident on your side
Check the dead-letter queue for the outage window and replay what was dropped.
- After rotating a signing secret
Watch for a sudden wall of 401s, which means one consumer did not get the new secret.