
Event log
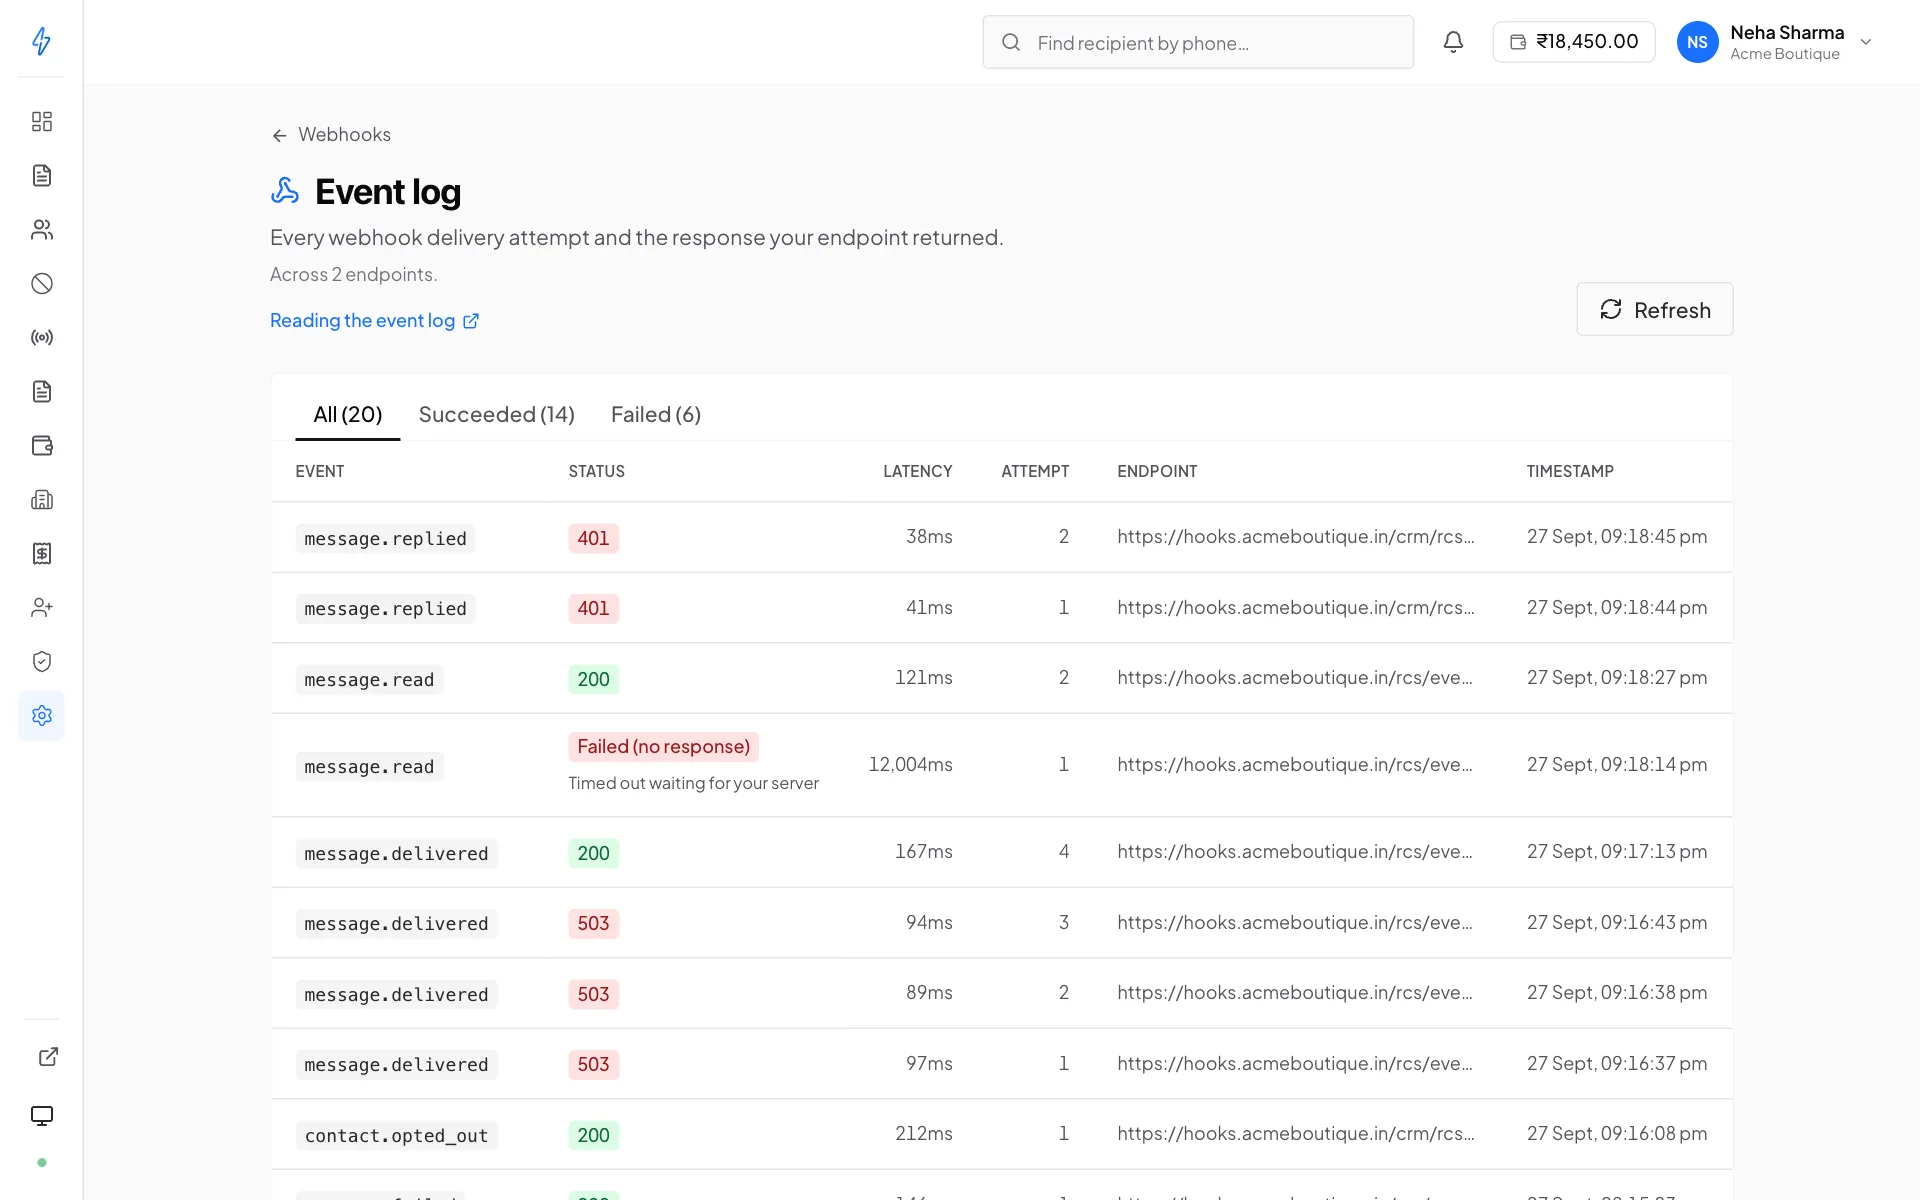
Every outbound webhook attempt is recorded, the URL, the attempt number, the status code your endpoint returned, how long it took, and the first bytes of the body. This is the audit trail behind the panel's Settings → Event log screen.
Use it to answer the two questions that come up whenever a webhook integration misbehaves: did you actually send it? and what did my server say back?
GET  /api/v1/rcs/webhooks/{webhook_id}/deliveries
GET  /api/v1/rcs/webhooks/dead-letter
POST /api/v1/rcs/webhooks/dead-letter/{delivery_id}/replay
There is no single /events endpoint
The panel's consolidated Event log is assembled client-side. It lists your endpoints, then reads each one's attempts. See Rebuilding the consolidated log for how to do the same thing, and what its limits are.
Delivery attempts
/api/v1/rcs/webhooks/{webhook_id}/deliveries
Returns the most recent attempts for one endpoint, newest first.
GET /api/v1/rcs/webhooks/48b21f9a-7e87-4057-bee7-662879612c21/deliveries?limit=100
Authorization: Bearer <jwt>{
"success": true,
"deliveries": [
{
"attempt_id": "9c2f1d80-8500-11ef-9c9a-4bc60d7a1e2f",
"delivery_id": "wd_5f0a3c22-8501-11ef-8f3a-4bc60d7a1e2f",
"event_type": "message.delivered",
"url": "https://api.example.com/webhooks/splashifypro",
"attempt": 1,
"status_code": 200,
"took_ms": 143,
"response_snippet": "{\"ok\":true}",
"sent_at": "2026-08-25T04:11:09Z"
},
{
"attempt_id": "7a10bb4e-84ff-11ef-9c9a-4bc60d7a1e2f",
"delivery_id": "wd_2b7c9910-84ff-11ef-8f3a-4bc60d7a1e2f",
"event_type": "broadcast.completed",
"url": "https://api.example.com/webhooks/splashifypro",
"attempt": 3,
"status_code": 503,
"took_ms": 30012,
"response_snippet": "upstream connect error",
"sent_at": "2026-08-25T03:52:41Z"
}
]
}Reading the outcome
There is no explicit outcome field, derive it from status_code, exactly as
the panel does:
function outcomeOf(attempt) {
  // 2xx is success. Anything else failed, including 0: no HTTP answer at all.
  return attempt.status_code >= 200 && attempt.status_code < 300
    ? "succeeded"
    : "failed";
}
status_code 0 is a failure
An attempt is recorded once it has finished, so a zero never means "still going". It means your
endpoint gave no HTTP answer: the request timed out, the connection was refused, or the domain
did not resolve. response_snippet says which, and the attempt is retried like any other
failure. The panel shows it as Failed (no response).
Access and scope
Any role can read deliveries. A team member scoped to specific bots can only
read attempts for endpoints scoped to a bot they hold, requesting one outside
their scope returns 403 bot not in scope, and an unknown endpoint returns
404.
This is a recent tail, not full history
The route caps at 500 rows and has no cursor. There is no way to page backwards through older
attempts. For long-term retention, consume the attempts periodically and store them yourself, or
pull the same information from your own server's access logs by correlating on delivery_id.
Dead-letter queue
/api/v1/rcs/webhooks/dead-letter
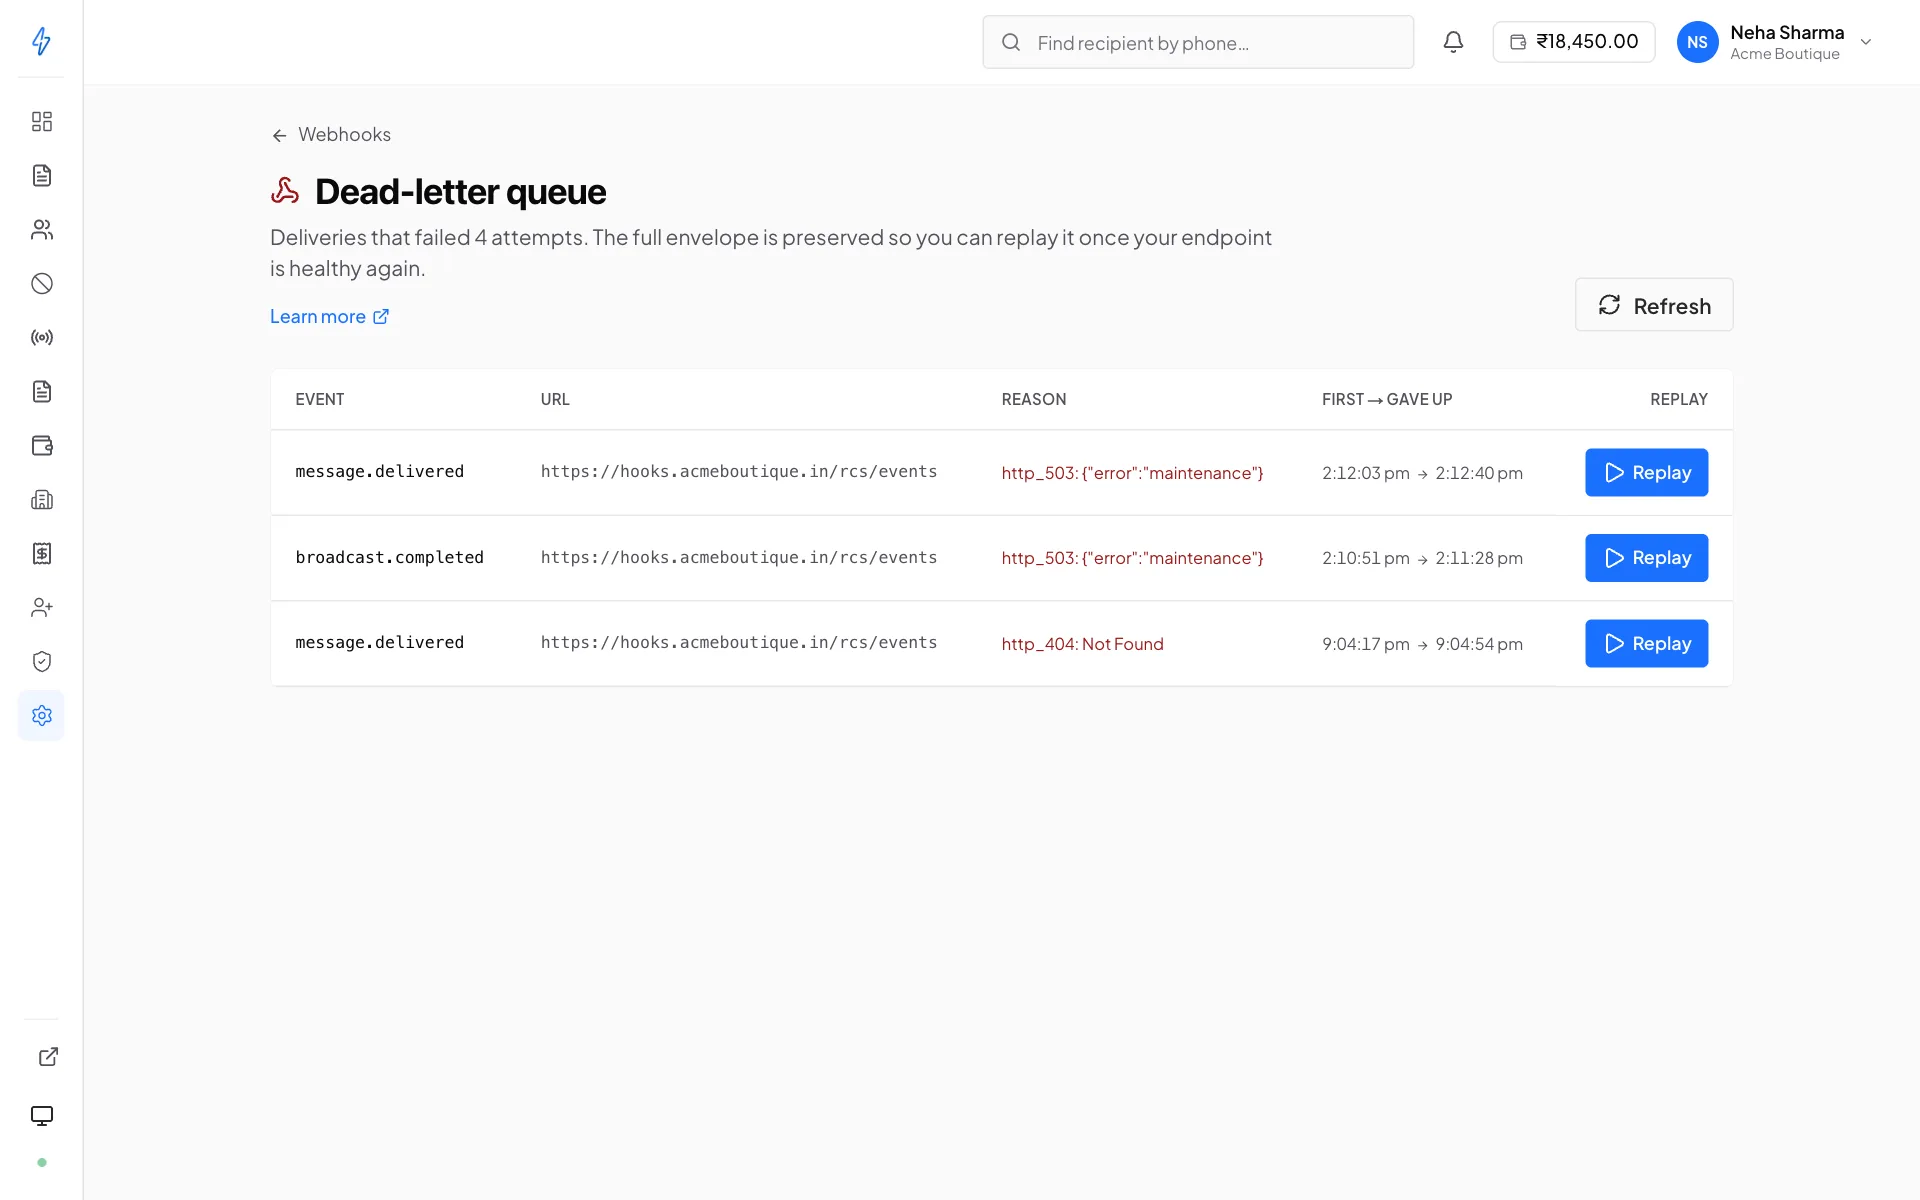
A delivery that fails its first attempt is retried three more times, at 1s, 5s and 30s. If all four fail, it is not retried again. It lands here with its full envelope preserved, waiting for you to replay it.
{
  "success": true,
  "items": [
    {
      "delivery_id":          "wd_2b7c9910-84ff-11ef-8f3a-4bc60d7a1e2f",
      "webhook_id":           "48b21f9a-7e87-4057-bee7-662879612c21",
      "event_type":           "broadcast.completed",
      "url":                  "https://api.example.com/webhooks/splashifypro",
      "reason":               "HTTP 503 after 4 attempts",
      "first_attempt_at":     "2026-08-25T03:52:11Z",
      "permanent_failure_at": "2026-08-25T03:52:47Z"
    }
  ]
}
Note the response key is items, not deliveries.
Scope filtering
For a caller scoped to all bots, every row is returned. For a scope-limited team member, rows are filtered server-side and a row is hidden when:
- its endpoint has since been deleted, or
- its endpoint is scoped to all bots (a scope-limited caller must not see account-wide traffic), or
- its endpoint's bot is outside the caller's scope
This means two people can legitimately see different row counts on the same queue. That is the scope working, not a bug.
Replay a dead-letter delivery
/api/v1/rcs/webhooks/dead-letter/{delivery_id}/replay
Re-queues the archived envelope for delivery, with a fresh delivery_id
and the attempt counter reset to 1, so it gets the full four-attempt retry
schedule again.
POST /api/v1/rcs/webhooks/dead-letter/wd_2b7c9910-84ff-11ef-8f3a-4bc60d7a1e2f/replay
Authorization: Bearer <jwt>{
"success": true,
"new_delivery_id": "wd_8e41c07a-8600-11ef-8f3a-4bc60d7a1e2f"
}The original row is deleted from the queue as part of a successful replay,
so the same delivery cannot be replayed twice by accident. Track
new_delivery_id if you want to follow the replay through the attempts
endpoint.
The payload is replayed as originally sent, same event, same data, same
occurred_at semantics. It is not re-derived from current state, so replaying
a broadcast.completed from last week delivers last week's counters.
Make your consumer idempotent before replaying
A replay is a genuinely new delivery of an event your server may already have partially processed
before it failed. Deduplicate on delivery_id from the original attempt, or on the business fact
in data, do not assume a replayed event is one your server has never seen.
Rebuilding the consolidated log
The panel's Event log shows attempts across every endpoint in one table. There is no server-side endpoint for that. It is assembled client-side, and you can do the same:
List the endpoints
GET /api/v1/rcs/webhooksreturns every subscription with itswebhook_id,urlandactiveflag.Read each endpoint's attempts, in parallel
GET /api/v1/rcs/webhooks/{id}/deliveries?limit=100for each. This is an N+1, and it is fine: N is the number of endpoints on an account, a handful, not a page of them.Degrade rather than fail
Catch per-endpoint errors and substitute an empty list. One endpoint failing should cost you that endpoint's rows, not the whole log.
Merge and sort by sent_at, descending
The rows carry no cross-endpoint ordering of their own.
const { webhooks = [] } = await api("/api/v1/rcs/webhooks");

let partial = false;
const perEndpoint = await Promise.all(
  webhooks.map((w) =>
    api(`/api/v1/rcs/webhooks/${w.webhook_id}/deliveries?limit=100`)
      .then((r) => r.deliveries || [])
      .catch(() => {
        // One endpoint's attempts failing must not blank the whole log.
        partial = true;
        return [];
      }),
  ),
);

const rows = perEndpoint
  .flat()
  .sort((a, b) => (a.sent_at < b.sent_at ? 1 : a.sent_at > b.sent_at ? -1 : 0));
Say so when the result is partial
Two things make this list incomplete: the per-endpoint cap, and any endpoint whose fetch failed. A table that silently implies completeness it does not have is worse than one that admits the limit, surface both, the way the panel does.
Debugging recipes
- “You never sent me the event”
Filter attempts by
event_typeand check whether a row exists. If it does,status_codeandresponse_snippetsay what your server replied, which usually settles it.- Intermittent failures
Group attempts by
delivery_id. Seeing attempts 1–3 fail and 4 succeed is the retry schedule doing its job; nothing needs fixing. Seeing every attempt time out at ~30000 ms intook_msis your endpoint being too slow, acknowledge with a 200 immediately and process asynchronously.- Everything failing since a deploy
Check
status_codeacross recent attempts. A wall of 401s or 403s usually means a rotated signing secret that the consumer was not updated for; a wall of 404s means the route moved.- A gap in your data
Read the dead-letter queue for that window. Anything there never arrived, no matter how healthy your logs look. Replay it.